Back
Similar todos
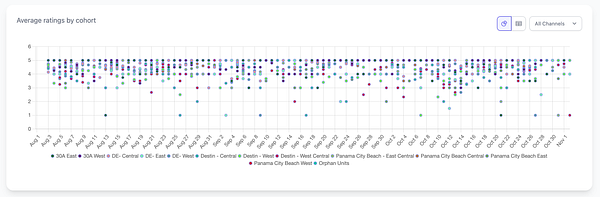
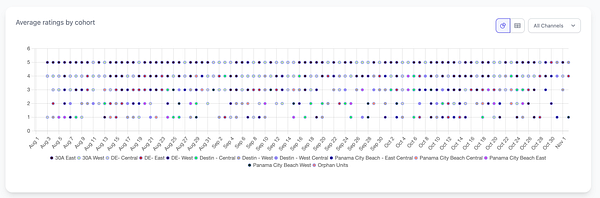
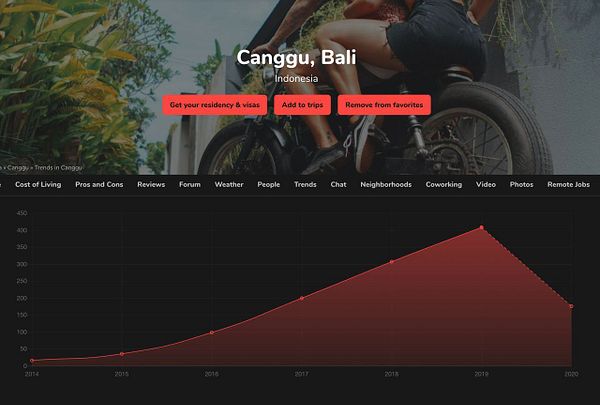
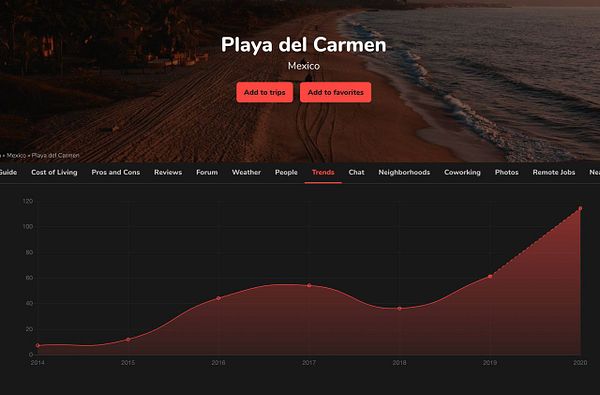
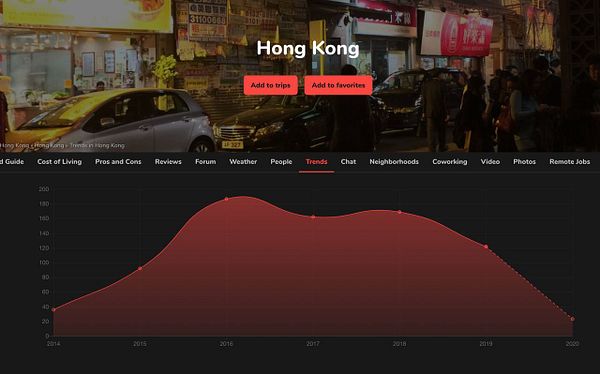
added charts to top trends pages #sponsorgap
See similar todos

No replies yet

historical data rechart #airflo
See similar todos

No replies yet

update analytics to be sexy new line chart with animation states and previous period comparison line #saasco
See similar todos

No replies yet

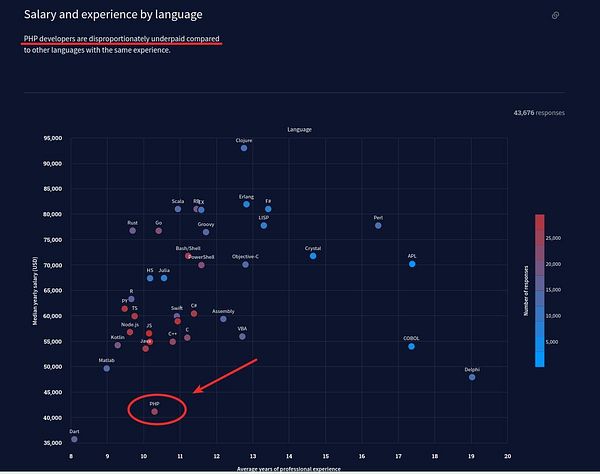
Made infographic with charts
See similar todos

No replies yet

Build charts to track user base, user growth, etc #decidr
See similar todos

No replies yet

Display last 10 days' data on graph. #dwh
See similar todos

No replies yet

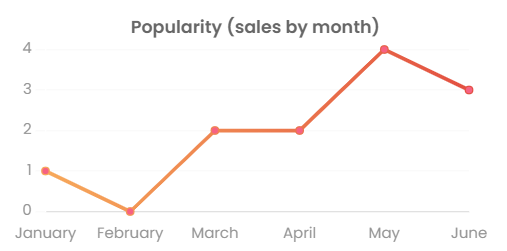
experiment with charts of historical data for widgets #dashful
See similar todos

No replies yet

worked on #djangonews stats collection on older articles to see what was popular
See similar todos

No replies yet

improve trend table with colors and multi-year history #nomads
See similar todos

No replies yet

Updated dashboard to display trends and to only display months there is data for. #outono
See similar todos

No replies yet

interactive charts #useattractor
See similar todos

No replies yet

Made charts responsive #visulry
See similar todos

No replies yet

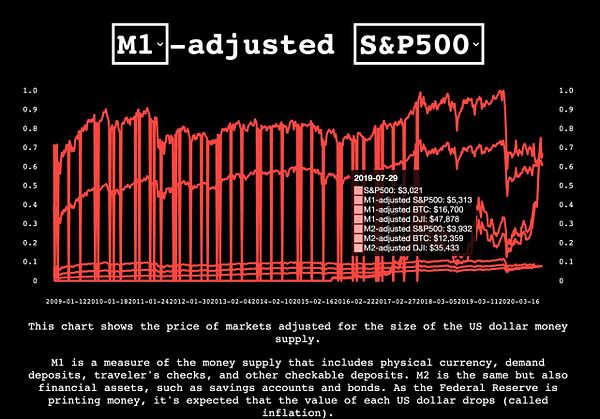
get data into chart #inflationchart
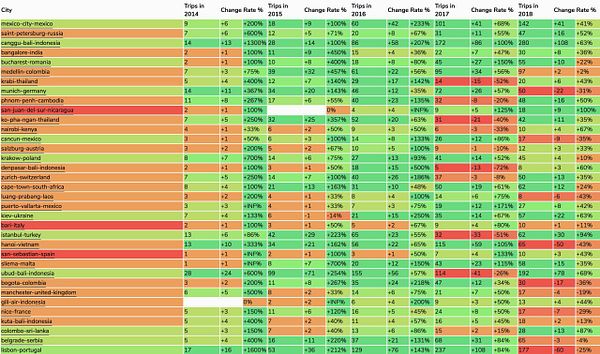
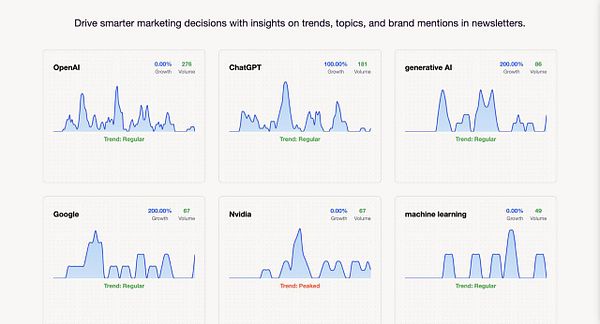
See similar todos

No replies yet

add Trends tab to every city to see which places growing or declining over time #nomads
See similar todos

No replies yet

calculate average experience in years for #remoteok stats so we can make a chart like this one I saw
See similar todos

No replies yet

post trends of 2018 to /r/dataisbeautiful #startupjobs
See similar todos

No replies yet

add data visualisation like beta.observablehq.com/@hugodf… #accountableblogging
See similar todos

No replies yet

show analytics with chartjs #cardmapr
See similar todos

No replies yet

Make purdy charts from initial data #buzzd
See similar todos

No replies yet

Make charts look better #visulry
See similar todos

No replies yet