Back
Similar todos
Load previous page…
fix stats.py, have it email me weekly stats, daily breakdown of API count and websites using ipdata. Also returning users, new users and some stats on growth
add data visualisation like beta.observablehq.com/@hugodf…  #accountableblogging
worked on  #djangonews stats collection on older articles to see what was popular
Dashboard for usage stats & cost  #melies
Display last 10 days' data on graph. #dwh
Pretty graphs and reports  #ctr
#ctr
Add usage charts to make infra costs fully transparent  #saasco
Doing some data analytics and macros for db  #dailywork
finished a script that used the curated api to pull stats in  #djangonews
share /open stats for July twitter.com/noCSdegree/status…  #nocsdegree
Do some data analysis  #jomo
#jomo
data analysis for project  #life
#life
used the cogapp to write a self-updating script to help feed in data for  #djangopackages
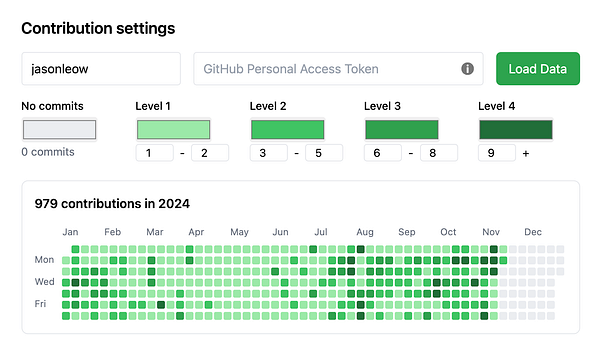
Made personal Github chart tool to generate my own commit charts with my own level settings, because I hate that a single high contribution day skews the shading algo and everything becomes pale green.. and loses info density - jasonleow.com/github-contribu… #githubchartremixer #commit365
Started refactoring usage stats processing, storing data locally (currently in Stripe), provide stats on a per API key with hourly granularity.  #2markdown
