Back
Similar todos
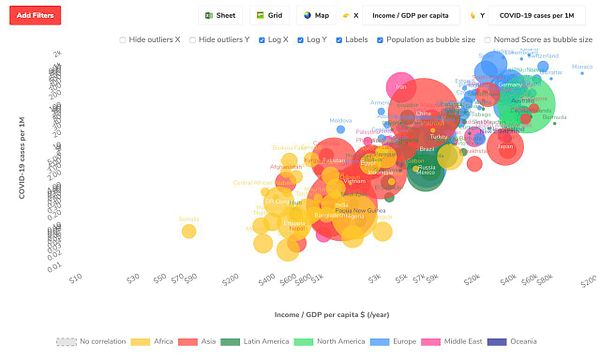
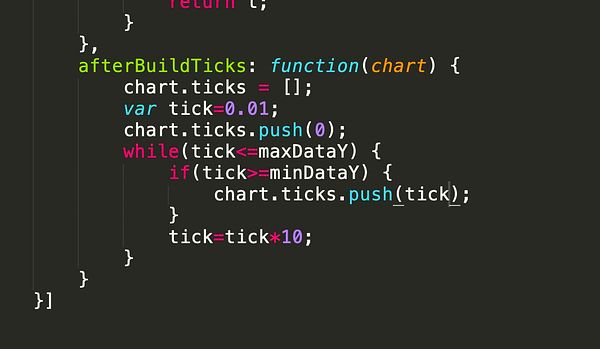
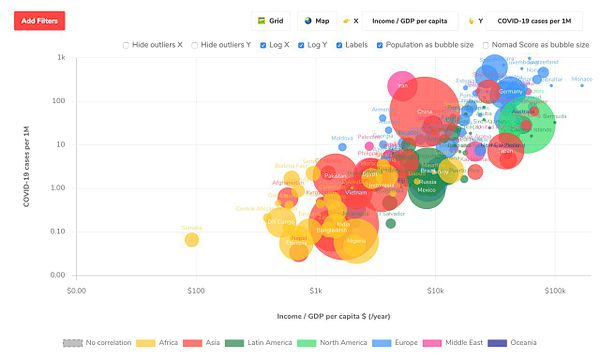
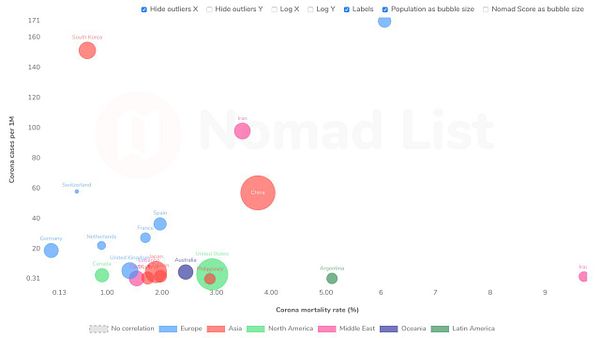
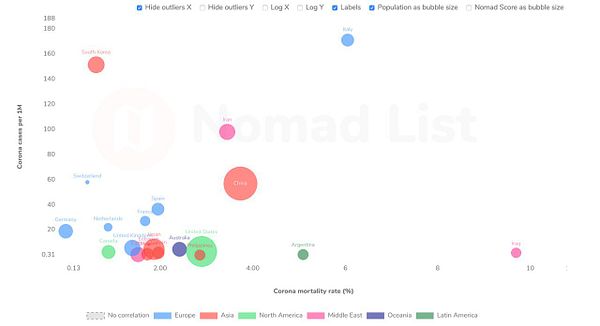
fix logarithmic axes labels by specifying them after the chart is built with "afterBuildTicks" and add labels like 0.01 0.1 1 10 100 1000 10000 etc within the min and max of the data range #nomads
See similar todos

No replies yet

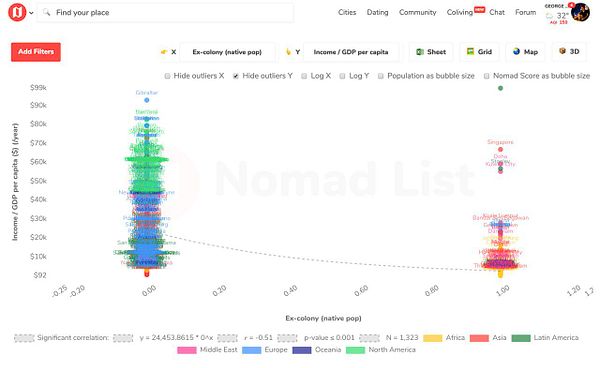
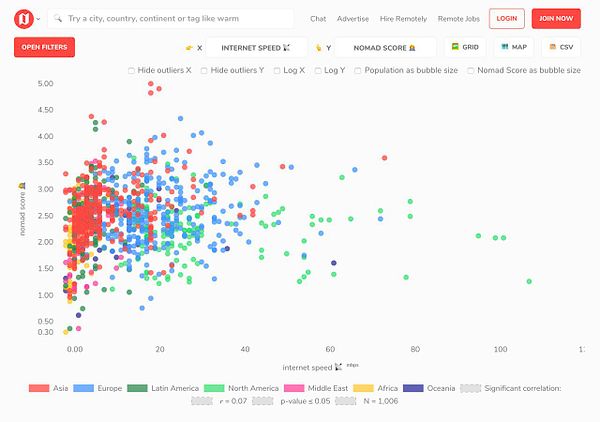
add padding (by modifying min and max of chart) if binary 0 or 1 data value (like true/false) to give space in chart #nomads
See similar todos

No replies yet

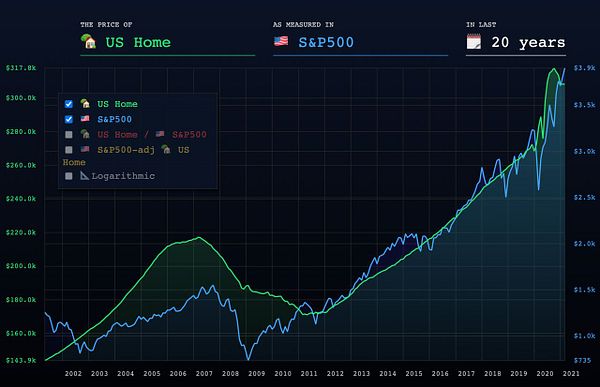
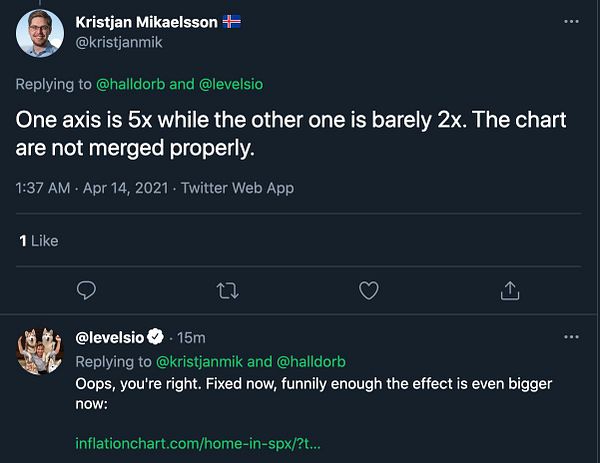
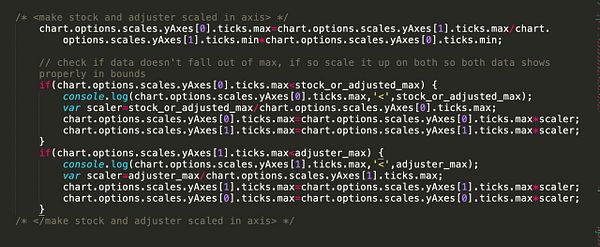
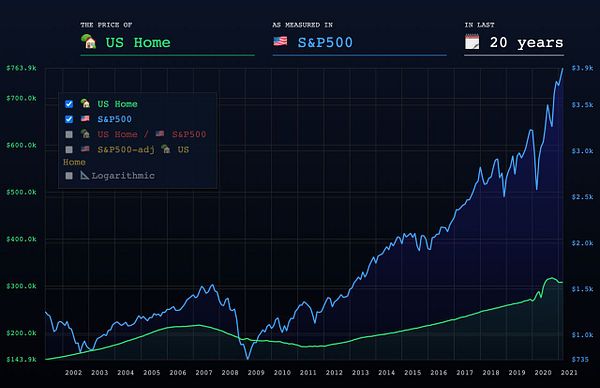
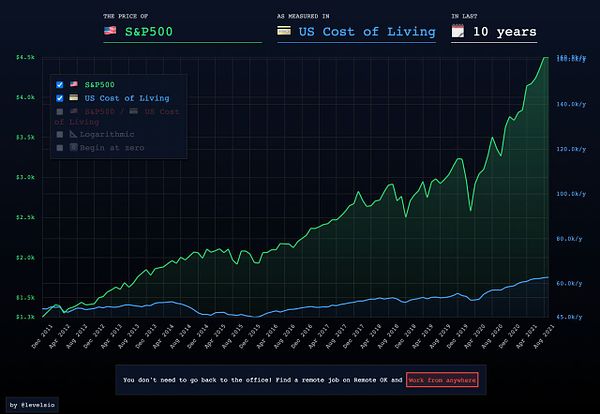
add 2 data variables relationship axes scaling so that min and max are always in same ratio to show fair data comparison (h/t @kristjanmik) twitter.com/kristjanmik/statu… #inflationchart
See similar todos

No replies yet

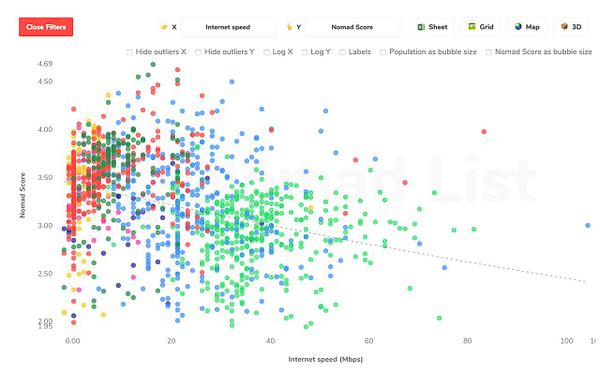
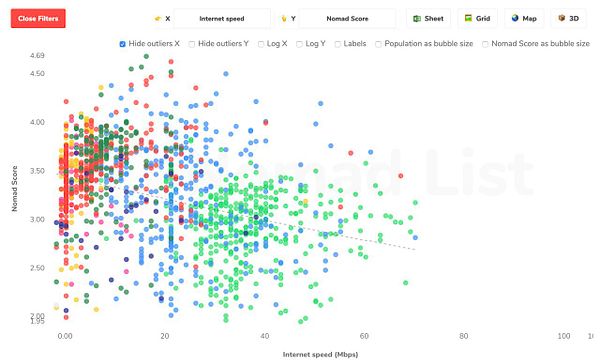
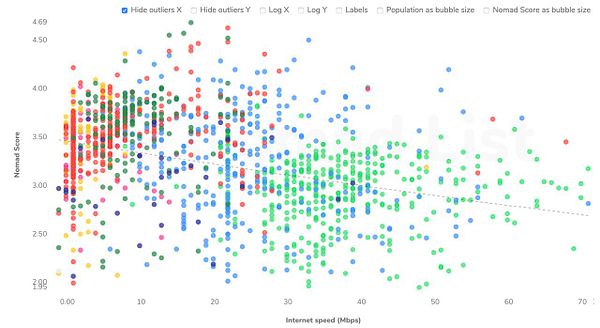
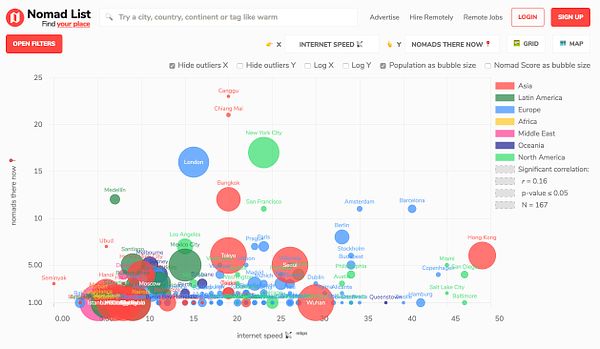
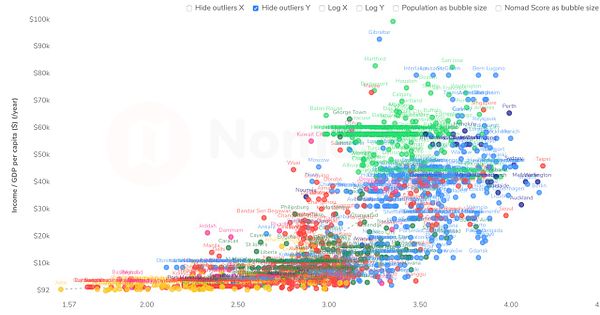
if you hide outliers on #nomads /chart X Y, it hides them but doesn't auto change max/min anymore to fit minimums
See similar todos

No replies yet

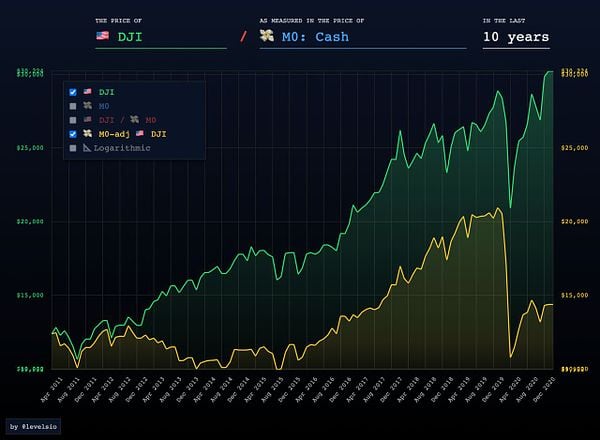
enable adjusted chart with proper min/max values that match the stock #inflationchart
See similar todos

No replies yet

Make graph width a %
See similar todos

No replies yet

add labels to the y axis #metrics
See similar todos

No replies yet

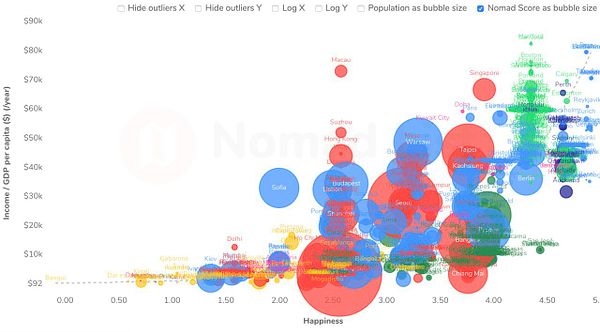
add 10% padding to maxDataX and maxDataY so that data points's labels above them don't fall of chart (e.g. Italy) #nomads
See similar todos

No replies yet

using d3-scale to calc the y-axis values #metrics
See similar todos

No replies yet

Fix bug with Y axis graph labels cutting off #givewithella
See similar todos

No replies yet

#pintura limit rotation when min width and height is set
See similar todos

No replies yet

fix in chart view Y axis "nomads there now" doesn't show chart #nomads
See similar todos

No replies yet

changes related to Min window size #trici
See similar todos

No replies yet

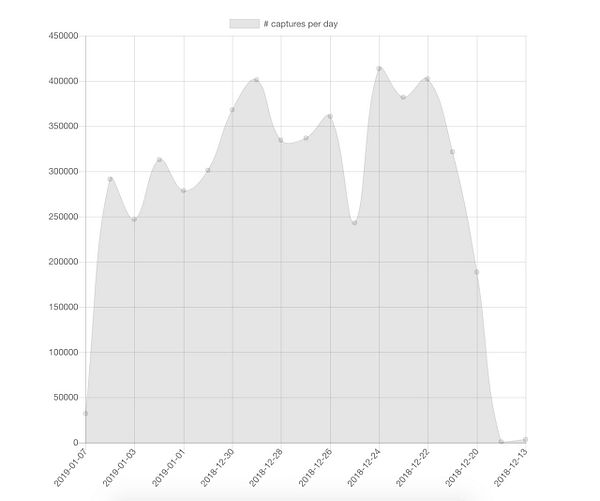
using a timescale for the graphs #metrics
See similar todos

No replies yet

hide gridlines and chart axes borders for cleaner chart layout #nomads
See similar todos

No replies yet

fix chart line ends somewhere in the middle not at the end of chart (top right) #nomads
See similar todos

No replies yet

add chartjs graph #freelancegig
See similar todos

No replies yet

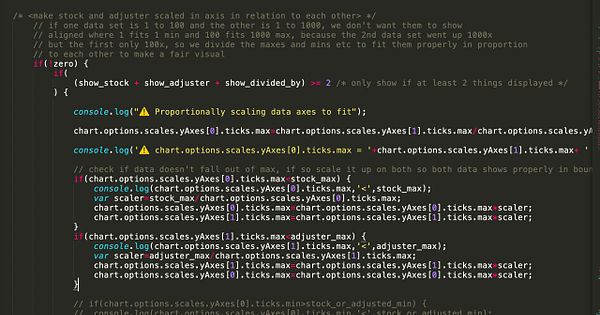
fix proportional scale match code #inflationchart so that two data sets line up in terms of proportion, e.g. data set A goes from 1 to 100, B goes from 1 to 1000, then A should show as 10% max of B
See similar todos

No replies yet

min-width on elements #placid
See similar todos

No replies yet

fix chartjs annotations #keylogs
See similar todos

No replies yet