Back
Inflation Chart
Inflation Chart
#inflationchart
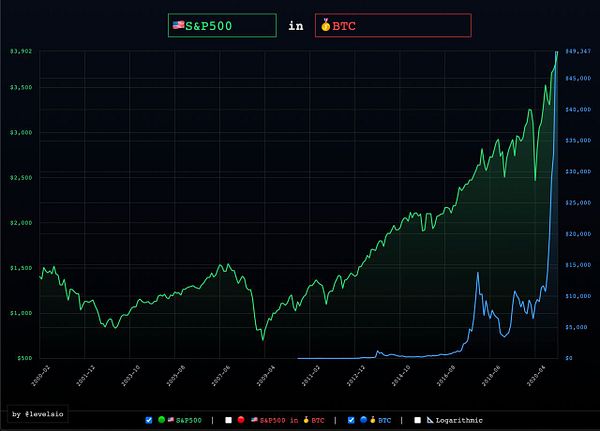
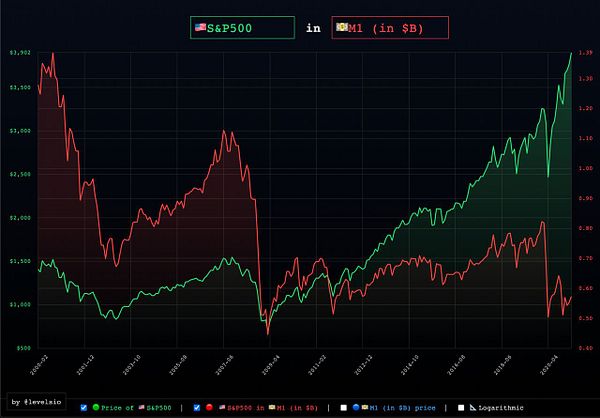
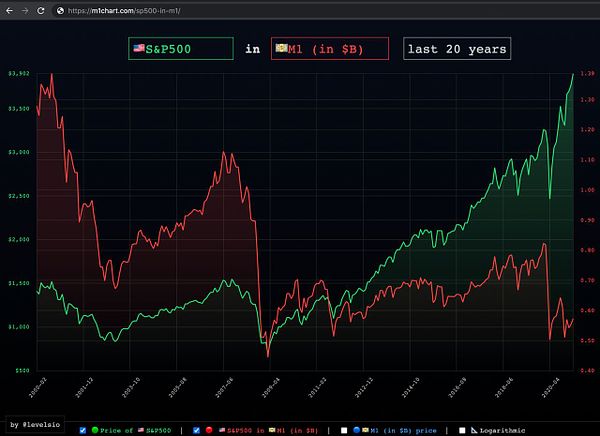
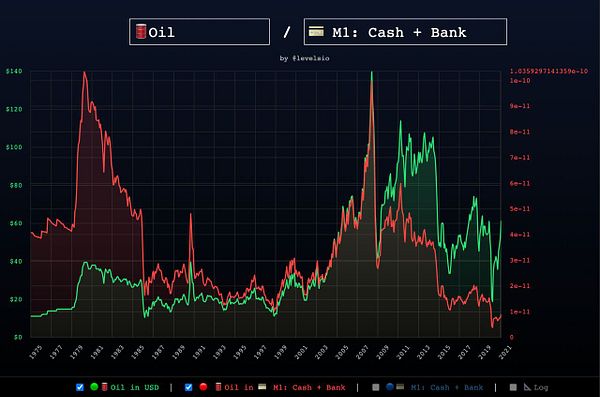
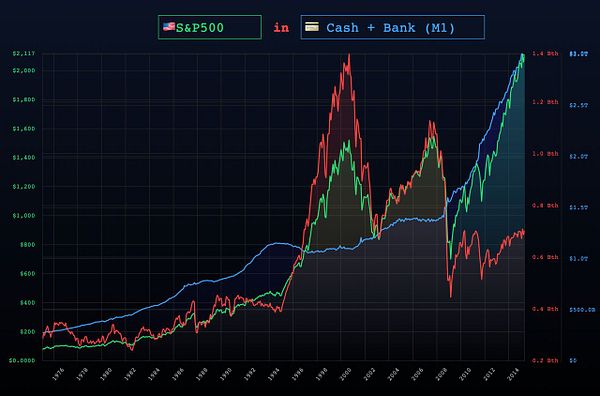
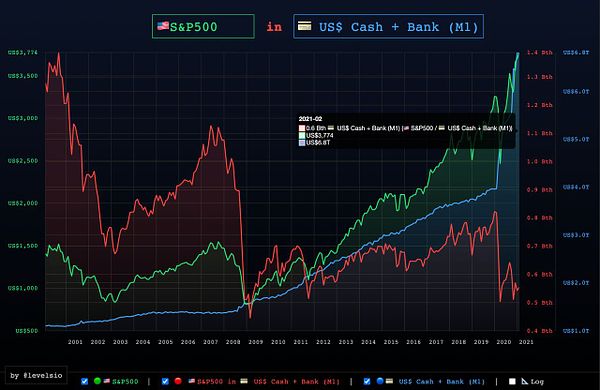
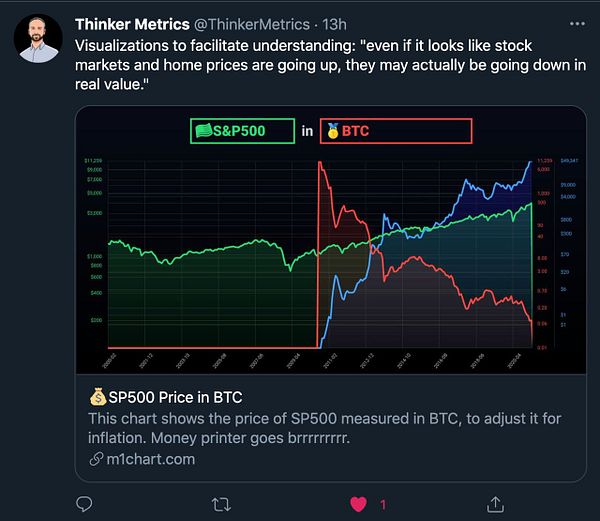
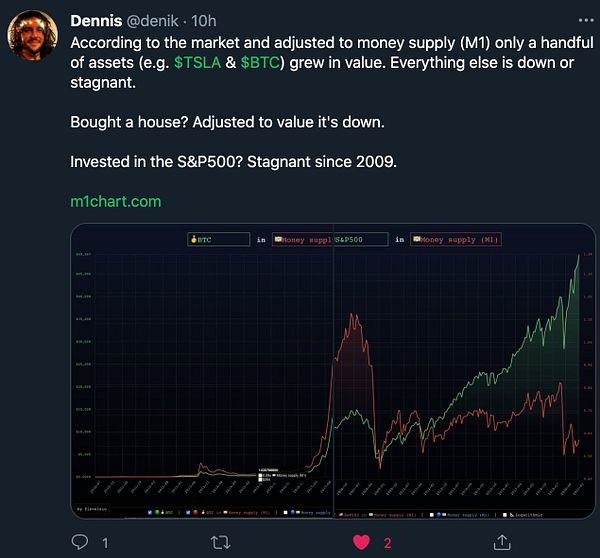
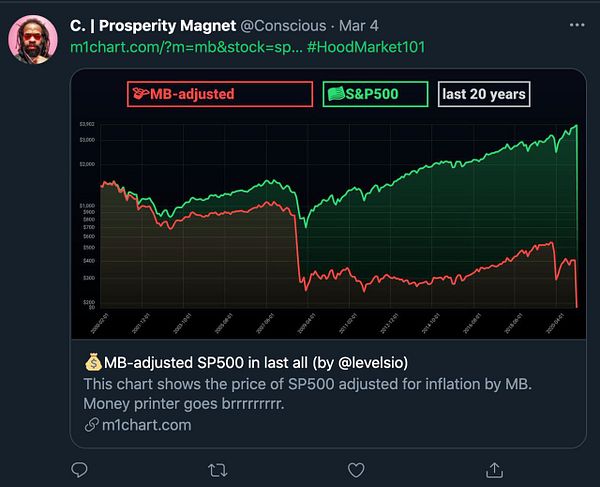
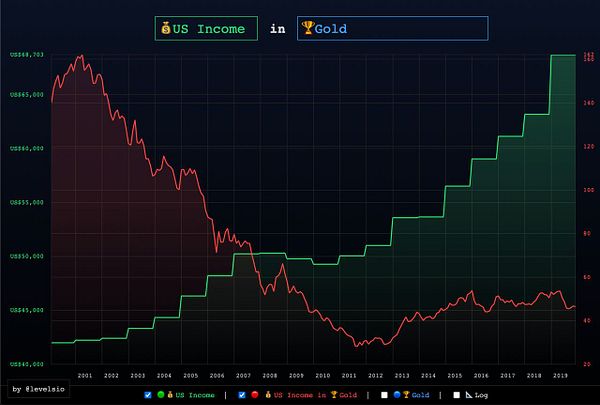
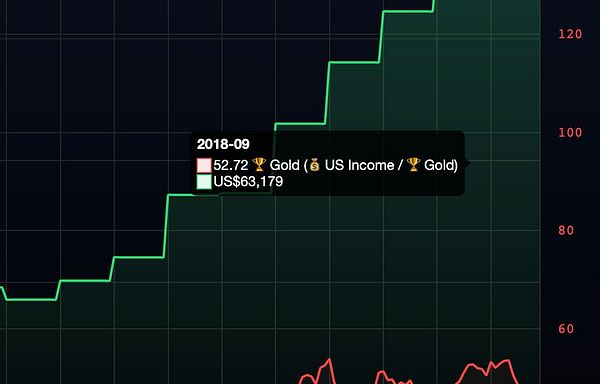
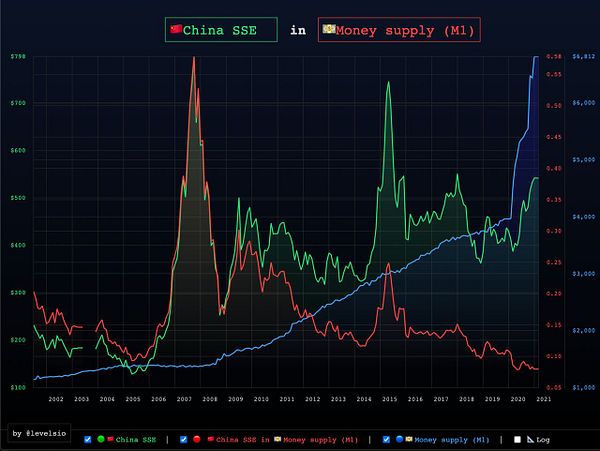
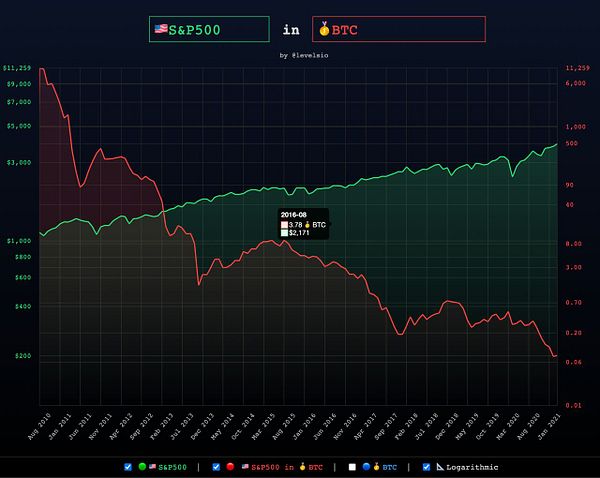
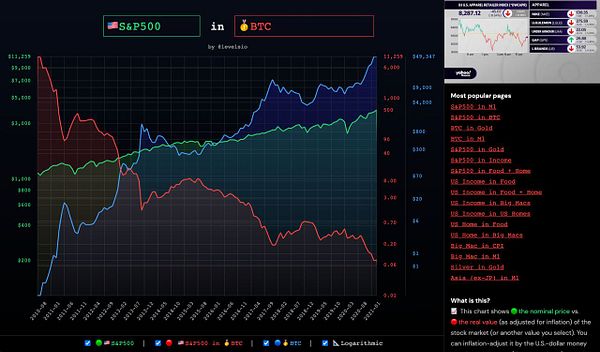
Show stock market growth adjusted for US dollar money supply
Launched February 12, 2021
Load previous page…
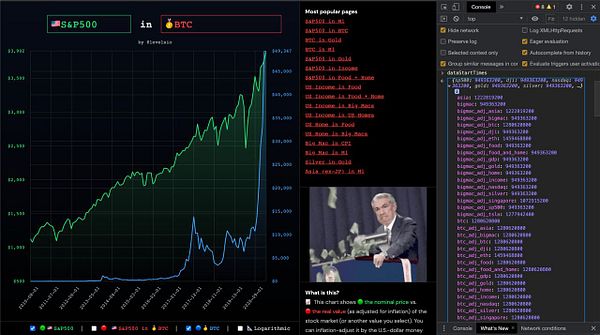
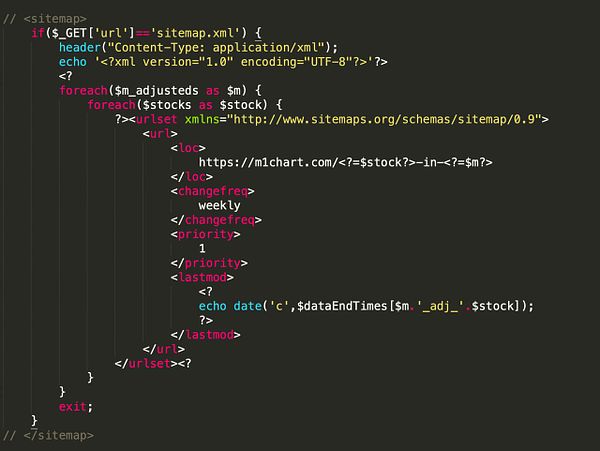
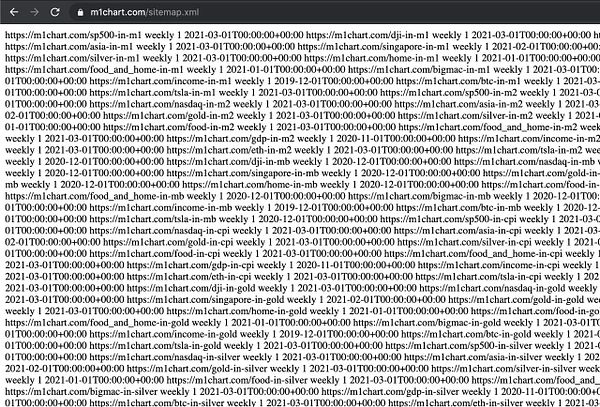
fix performance problems by not pre-loading 400 combinations of chart data going back to 1970 for every month but instead loading only the stock, the adjuster and the combination (n=3)  #inflationchart
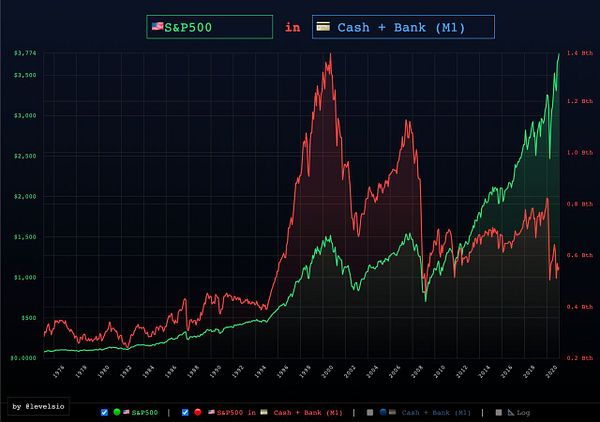
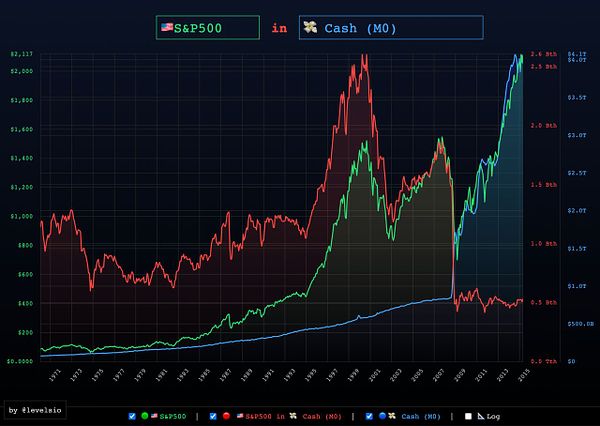
add Trillionth, Billionth, Millionth, so we can divide for ex S&P500 at $1900 by money supply of $6,000,000,000,000 (Trillion) #inflationchart
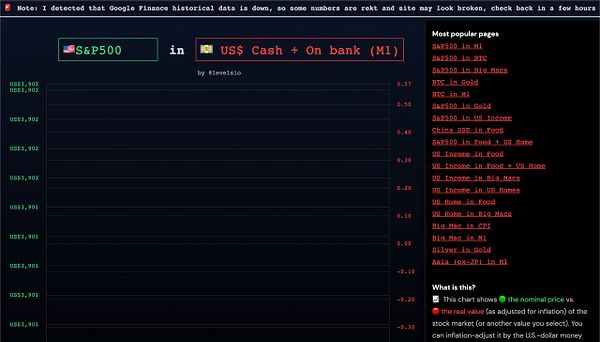
add auto warning if =GOOGLEFINANCE() historical data function not working because it intermittenly dies #inflationchart
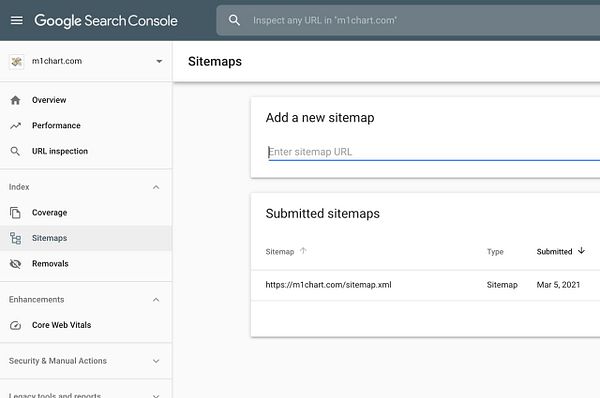
specify dataStartTimes and dataEndTimes so the chart dynamically resizes horizontally based on available data, for ex. BTC starts in 2009 so we can’t show data before that #inflationchart